How best to handle Soriano's injury?
4 Comments Published by Colin Wyers on Tuesday, April 15, 2008 at 9:25 PM.Let's assume for a moment that he's only going to be out a few days. That assumption means no callups. How best to deal with Soriano's injury? (When I say wins, I mean WAR over a full season.)
DeRosa in left, Fontenot at second?
This should come as no surprise to you - DeRosa is less valuable as a left fielder than as a second baseman - by about half a win. Fontenot, meanwhile, is somewhere between 1 to 1.5 wins worse than DeRosa at second.
Ward in left?
Ward is below replacement as a left fielder, given his atrocious defense in the outfield. In fact, the more I think about it, the more I don't like having Ward on the team. He makes the bench seem a lot shorter than it really is.
Johnson in left?
Probably the best option; it's, after all, why teams carry fourth outfielders. That means keeping Pie in the lineup, however, which the team has seem reluctant to do so far this season.
Labels: Alfonso Soriano, Baseball, Chicago Cubs, Felix Pie, Mark DeRosa, Reed Johnson, WAR
2008 Cubs Opening Day Roster, by WAR, Part II
4 Comments Published by Colin Wyers on Thursday, March 27, 2008 at 11:41 AM.This is really rushed - suffice it to say that I don't think a lot of people will be pleased with what I'm going to call the Kerry Wood Issue, and I don't have a good answer for you right now. Otherwise, I like what I'm seeing with our pitching staff.
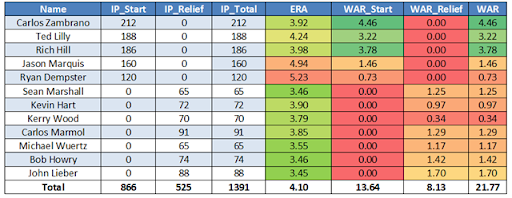
This is park adjusted. Thanks to Sam Larson for some tweaks to the relief pitcher calculations.
I'm really not married to any of these forecasts, and hope to publish a revised set of both charts this weekend. I just know that if I didn't publish something, I would forget to do so entirely.
Labels: Baseball, Chicago Cubs, Pitching, WAR
2008 Cubs Opening Day Roster, by WAR
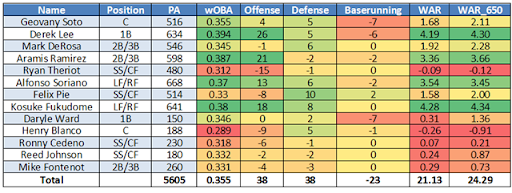
10 Comments Published by Colin Wyers on Wednesday, March 26, 2008 at 11:23 PM.Hitters only. Let's get straight to the bidness:
Someday I'll look into actually putting these charts together in a more interactive format, but Excel outputs such awful HTML, and I really don't feel like messing with it myself at this point. (EditGrid and Google Docs don't support the fancier formatting, either.)
If you're late to the party, I explain WAR in a previous post. WAR stands for Wins Above Replacement, and it measures a player's overall contribution to team wins. WAR_650 is a new stat that prorates WAR out to 650 plate appearances. Offensive production is now park adjusted as well. [An updated version of the WAR calculator should be ready for release here soon, incorporating these refinements.]
These are all based on projected stats. For offense and wOBA, I made a composite of:
- The Bleed Cubbie Blue community projections
- PECOTA
- CHONE
- ZiPS
- Marcels
Defense is based on Sean Smith's defensive projections. Baserunning projections are very crude, and involve a bit of Kentucky windage; they're based on my baserunning metrics.
Things to draw from the chart:
- The Cubs look to have a very fine offense this season.
- They look to have a very good defense again.
- They're miserable at running the bases.
- I love to color-code things.
- Ryan Theriot sucks.
So, basically, nothing you didn't already know. I hope to get around to the pitchers by opening day, but no promises.
Labels: Baseball, Chicago Cubs, Defense, Projections, WAR
The sort of things that actual ballclubs don't do, but should consider
4 Comments Published by Colin Wyers on Sunday, March 23, 2008 at 8:54 AM.Okay, so there's talk of the Cubs acquiring Felipe Lopez. On the surface, this looks pretty dumb - if the Cubs were going to acquire a guy that plays shortstop, there were a lot of better options available earlier in the offseason. And Lopez provides more value than Theriot according to my new, park-adjusted WAR chart (which I'm still cleaning up, in addition to some other projects) but not to the extent where I thing it would show up in the standings -a tenth of a win isn't much to write home about.
But let's think outside of the box here. Lopez had a bad season last year at the plate, but even so still outhit Ryan Theriot after you adjust for park effect. Of the two, Lopez is a better bet to hit well. On the flipside, Ryan Theriot is the better defensive player. If you combined Lopez's hitting with Theriot's fielding, you might have a legitimate major league shortstop.
Well... can we do that?
Let's take a look at some of the Cubs pitching staff. For example, last season, 46.9 % of the balls put into play off Carlos Zambrano were ground balls. With Rich Hill, only 36.0 % of his balls in play were grounders. Here's the breakdown:
- Zambrano, 46.9%
- Lieber, 43.8 %
- Marquis, 49.5 %
- Dempster, 47.1 %
- Lilly, 33.7 %
- Hill, 36.0%
Do you see where I'm headed with this? Give Lopez as much time as possible playing behind Hill and Lilly, and give him plenty of time off when whichever of Lieber, Marquis or Dempster are on the mound, and have they pretty much split time with Z (whose high strikeout rate lets him overcome defensive inadequacies behind him). You might end up with a halfway to decent shortstop that way.
Labels: Baseball, Chicago Cubs, Felipe Lopez, Ryan Theriot, WAR
Ranking shortstops for 2008
9 Comments Published by Colin Wyers on Saturday, February 23, 2008 at 12:56 PM.People often say, "You can't have an All Star at every position!" Know this (tattoo it on yourself where you'll see it if you think you'll forget): any time this is brought up, you're talking about a crappy ballplayer. I mean, seriously. Nobody starts off conversations about good ballplayers that way. It's some sort of red flag that people want to keep a baseball player on the field for non-baseball reasons.
Apply that sort of thinking to your everyday life. Say your kid brings home a report card with an F on it. How would you react if he said, "You can't have an A+ in every class!" Or say your spouse is responsible for making dinner and sets it (and the kitchen) ablaze. "You can't have filet mignon at every meal!"
I'm not asking for straight As, and I'm not asking for fancy French cooking. I'm asking for the shortstop equivalent of a C, or some chili macaroni Hamburger Helper. I'm looking for average. It's a total straw man argument.
To go ahead and illustrate my point, I've compiled a list of what I've supposed to be the starting shortstops for every team in the majors, and calculated Wins Above Replacement using Sean Smith's projections. [In the case of the Angels and the Nationals, I've used two shortstops.] I've also included perpetual Cubs fan favorite, the Great Destroyer himself, Ronny Cedeno.
I held playing time constant for all players, and have not used any park adjustments. Both of those (false) assumptions would tend to favor Ryan Theriot in comparison to other shortstops.
Cubs players are in bold.
| Name | Team | League | wOBA | Defense | WAR |
| Troy Tulowitzki | COL | NL | 0.356 | 14.00 | 4.06 |
| Miguel Tejada | HOU | NL | 0.373 | 0.00 | 3.74 |
| Jose Reyes | NYM | NL | 0.349 | 6.00 | 2.98 |
| Jimmy Rollins | PHI | NL | 0.355 | 2.00 | 2.95 |
| Jason Bartlett | TBA | AL | 0.32 | 13.00 | 2.50 |
| Hanley Ramirez | FLA | NL | 0.375 | -17.00 | 2.35 |
| JJ Hardy | MIL | NL | 0.348 | -1.00 | 2.31 |
| Adam Everett | MIN | AL | 0.283 | 31.00 | 2.10 |
| Derek Jeter | NYA | AL | 0.358 | -15.00 | 2.07 |
| Khalil Greene | SDN | NL | 0.33 | 7.00 | 2.05 |
| Jhonny Peralta | CLE | AL | 0.345 | -8.00 | 1.99 |
| Jack Wilson | PIT | NL | 0.327 | 7.00 | 1.88 |
| Michael Young | TEX | AL | 0.352 | -14.00 | 1.84 |
| David Eckstein | TOR | AL | 0.323 | 3.00 | 1.78 |
| Edgar Renteria | DET | AL | 0.33 | -2.00 | 1.71 |
| Rafael Furcal | LAN | NL | 0.331 | 1.00 | 1.57 |
| Macier Izturis | LAA | AL | 0.333 | -6.00 | 1.52 |
| Yunel Escobar | ATL | NL | 0.34 | -6.00 | 1.43 |
| Orlando Cabrera | CHA | AL | 0.323 | -1.00 | 1.43 |
| Alex Gonzalez | CIN | NL | 0.323 | 4.00 | 1.40 |
| Ronny Cedeno | CHN | NL | 0.331 | -1.00 | 1.40 |
| Stephen Drew | ARI | NL | 0.339 | -6.00 | 1.38 |
| Julio Lugo | BOS | AL | 0.321 | -3.00 | 1.14 |
| Bobby Crosby | OAK | AL | 0.306 | 6.00 | 1.13 |
| Omar Vizquel | SFN | NL | 0.302 | 10.00 | 0.80 |
| Ryan Theriot | CHN | NL | 0.312 | 1.00 | 0.55 |
| Yuniesky Betancourt | SEA | AL | 0.312 | -5.00 | 0.48 |
| Tony Pena | KCA | AL | 0.279 | 10.00 | 0.03 |
| Cesar Izturis | SLN | NL | 0.295 | 2.00 | -0.28 |
| Christian Guzman | WAS | NL | 0.31 | -9.00 | -0.45 |
| Felipe Lopez | WAS | NL | 0.316 | -13.00 | -0.48 |
| Erick Aybar | LAA | AL | 0.288 | -10.00 | -1.25 |
| Luis Hernandez | BAL | AL | 0.268 | 1.00 | -1.36 |
So, when I say that almost anybody would be an improvement on Ryan Theriot, I'm not exaggerating or showing some sort of bias against scrappy white guys. He's not the worst starting shortstop in the majors, but he's not too far away.
Now, obviously this is based upon projections of performance, and those projections could be wrong. The projections on offense are probably more reliable than the projections on defense. But that's as true for Troy Tulowitzki as it is for Luis Hernandez. Unless you have a specific reason that the projections are underrating Ryan Theriot relative to the other shortstops in baseball, I don't see a reason to think he'll be very good for the Cubs next year.
He's an average defender at shortstop - he's got sure hands, even if his range isn't very good; not a butcher like Michael Young or Hanley Ramirez, but not a solid defender like Troy Tulowitzki or Omar Vizquel. At the same time he's not a very good hitter - he's not as bad as the Felipe Lopez/Christian Guzman contingent, but he's certainly not even in the vicinity of the Orlando Cabrerra/Alex Gonzlez "respectable but not spectacular" benchmark. He does nothing particularly well.
The worst part of it is, you do not need a lot of advanced metrics to figure this out. The fact that his defense is good but not spectacular should be readily obvious to the armchair scouts out there; Cubs fans voting in the Fan's Scouting Report pretty much came to that conclusion. Cubs fans are equally able to figure out his deficiencies on offense; the Community Projections over at Bleed Cubbie Blue were very much in line with what other projection systems were saying.
In fact, let's rerun his WAR, this time using nothing more than the collected wisdom of Cubs fans. Converting the Fans' Scouting Report to runs using Tango's method puts Theriot at plus 7 runs; for a projection we really should factor in aging and regression to the mean, but screw it. Fans project Theriot to have a .316 wOBA, a whole four points above CHONE. That works out to a WAR of 1.29 - certainly more optimistic than what I have here, but far from outstanding.
As a group, Cubs fans seem very able to figure out Ryan Theriot's absolute value as a player. So why do they seem so unable to grasp his relative value? Maybe it's just a case of the vocal minority skewing my perception of Cubs fans, I dunno.
As a bonus, some quick, largely non-Cubs related, thoughts:
- Troy Tulowitzki is an absolute monster. The second-best defensive shortstop in the game, and a solidly above-average hitter? There's a Coors Field effect in there, but damn.
- Plus 31 runs for Adam Everett? Holy crap. If you can think of a more underrated player in all of baseball, I'd love to hear your thoughts.
- Tejada shows up rather better than I thought he would. Without knowing the precise aging curve that Sean Smith used for his defensive projections, I'd have to be tempted to take the under on that projection, though.
- Erick Aybar is just bad. Just... bad. I really wonder what the Angels are planning to do about that.
- The Red Sox can't be happy about the Julio Lugo signing right now.
- What the hell, Cardinals? Cesar the Wonder Out is making $2.85 million on a one-year deal; Eckstein is making $4.5 million on a one-year deal. There's almost no way that the difference in performance between the two is worth $1.5 million - and it's possible that Eckstein would have given the Cardinals a hometown discount. Especially given Eckstein's marketing potential for the Cards (he's absolutely beloved by them), this is just stupid on their part.
Labels: Baseball, Chicago Cubs, Defense, Linear Weights, Projections, Ronny Cedeno, Ryan Theriot, WAR
Updated WAR chart for hitters
5 Comments Published by Colin Wyers on Tuesday, February 19, 2008 at 11:45 PM.I decided to do something a little different this time and break down the chart by positions. It helped me sort out some of the playing time issues, at any rate, and I think it's rather nifty to look at. Guys like DeRosa, Cedeno and Murton who are expected to play multiple positions get the most milage out of it.
| Name | PA | wOBA | Defense | WAR |
| PITCHER | 370 | 0 | ||
| CATCHER | ||||
| Geovanny Soto | 512 | 0.355 | 0.50 | 3.28 |
| Henry Blanco | 188 | 0.301 | 0.50 | 0.36 |
| JD Closser | 48 | 0.323 | 0.00 | 0.15 |
| FIRST BASE | ||||
| Derrek Lee | 632 | 0.396 | 0.50 | 4.39 |
| Daryle Ward | 50 | 0.354 | -1.43 | 0.04 |
| Mark DeRosa | 22 | 0.342 | 0.00 | 0.04 |
| SECOND BASE | ||||
| Mark DeRosa | 422 | 0.342 | -0.57 | 1.00 |
| Mike Fontenot | 225 | 0.317 | -0.29 | 0.16 |
| SHORTSTOP | ||||
| Ryan Theriot | 542 | 0.312 | -0.10 | 0.69 |
| Ronny Cedeno | 130 | 0.331 | -0.10 | 0.37 |
| THIRD BASE | ||||
| Aramis Ramirez | 572 | 0.385 | -0.19 | 3.71 |
| Mark DeRosa | 112 | 0.342 | 0.00 | 0.36 |
| Ronny Cedeno | 20 | 0.331 | -0.29 | 0.04 |
| LEFT FIELD | ||||
| Alfonso Soriano | 621 | 0.371 | 0.57 | 3.53 |
| Matt Murton | 110 | 0.357 | 0.29 | 0.45 |
| Daryle Ward | 60 | .354 | -1 | 0.12 |
| CENTER FIELD | ||||
| Felix Pie | 556 | 0.328 | 1.43 | 2.66 |
| Ronny Cedeno | 68 | 0.331 | -0.67 | 0.14 |
| Sam Fuld | 65 | 0.307 | -0.10 | 0.06 |
| RIGHT FIELD | ||||
| Kosuke Fukudome | 560 | 0.381 | 0.95 | 3.96 |
| Matt Murton | 110 | 0.357 | 0.12 | 0.43 |
| Sam Fuld | 38 | 0.307 | -0.10 | 0.03 |
| DH/PH | ||||
| Matt Murton | 60 | 0.328 | 0.00 | 0.08 |
| Daryle Ward | 70 | 0.344 | -1.43 | 0.04 |
| 6103 | 26.08 |
I plan on cleaning up the presentation of this and doing some other things with it, but I'd like to get some feedback on it for the time being. wOBA is still pretty much entirely driven by CHONE, and I plan on doing some minor revising in that department. Pitcher hitting is entirely accounted for, and there's about 200-300 replacement-level at-bats included in there, so I don't think I'm being unreasonable about playing time.
Labels: Baseball, Chicago Cubs, Linear Weights, Projections, WAR
If you'd like to go ahead and calculate WAR yourself, then go to Sean Smith's stat site; my WAR calculation spreadsheet is available for download there. I'd like to thank Sean for making that available.
Unlike with the version on EditGrid, it's not autopopulated with Cubs data - it is, however, set up to make it scaldingly easy to figure out the WAR for any player, NL or AL. Download the CHONE projections and look up the defense projections available there for all the data you need.
Maddog commented on the WAR chart, and I thought I should go ahead and clarify a few things.
First, like I said there, pitcher hitting is already accounted for in the replacement level - all NL teams have pitchers hitting, so unless you think the Cubs pitchers are going to hit significantly worse than other teams its a nonissue.
The other issue is the total amount of plate appearances. I projected 6145 plate appearances for the Cubs; last season the Cubs; last year the Cubs had 6268 plate appearances. So by that standard it would appear I'm not leaving enough room for the 400 or so PAs by pitchers, or for replacement level hitting.
And... I didn't. But it's not as bad as you might think, because plate appearances are a function of On-Base Percentage - you can "buy" more plate appearances for your team by making fewer outs per plate appearance. I'm expecting rougly 2,400 plate appearances out of the Cubs for next season, based on their increased OBP.
So, I still need to take 200-300 PAs off the depth chart, and I'll work on that for tomorrow.
And maddog is right - someone is going to provide stats that look below replacement level, at some point, for the Cubs next season. But that's completely irrelevant, because remember, replacement level is an average of a group of players - some are going to fall above/below the actual replacement line, both as a function of sample size and of distribution.
Put another way - the Cubs gave playing time to several players last season that could be described as "replacement level," given the definition I'm using:
- Ryan Theriot
- Mike Fontenot
- Angel Pagan
- Koyie Hill
- Rob Bowen
- Ronny Cedeno
- Sam Fuld
You can add or subtract from that list as you please; doesn't really bother me any. Some of them outperformed the replacement baseline, and some of them underperformed the replacement baseline. When you average that out, you get replacement level production. You don't need to specifically account for below replacement player production.
But you do need to give below-replacement players a share of the plate appearances, which again, I didn't do well enough. So I will revise the chart tomorrow.
Also, I'm planning on doing positional breakdowns starting tomorrow, so we can start to look at some chaining issues, see how injury might affect the team, and take a look at positions where the team might have some unanswered questions.
Labels: Baseball, Linear Weights, Projections, WAR
Harry Pavlidis over at Cubs f/x has a good overview of how capable Cintron is(n't).
Let's take a look at this based on our Cubs WAR chart:
| PA | wOBA | Defense | WAR | |
| Ryan Theriot | 542 | .312 | -.10 | .69 |
| Ronny Cedeno | 275 | .331 | -.10 | .79 |
| Alex Cintron | 275 | .234 | -.19 | -1.30 |
What does this mean?
- Hendry somehow managed to find a way to sign a shortstop worse than what we have already.
- Interestingly enough, Theriot is somehow less valuable than Ronny Cedeno despite getting almost twice as many PAs on my depth chart.
- Wow, Alex Cintron is bad.
- Wow.
So... suffice it to say that Alex Cintron is not an infield predator. This is just a minor league, though, and Hendry says the right things:
"Obviously he had a few snags last year coming off (elbow) surgery," general manager Jim Hendry said. "But our people have been watching him in Puerto Rico. I think he'd done some working out with Carmelo Martinez earlier in the year, so we’ve had our eye on him. We felt like it made sense, especially with (Ronny) Cedeno getting some outfield time in the spring. So we felt like we needed someone else in camp that could play shortstop other than (Ryan) Theriot and Ronny."
It's okay to sign a replacement player at replacement salary if that's all you use him as. If Cintron ends up in AAA Iowa I'm perfectly happy with this. If not... well, kiss two wins goodbye.
Oh, and for those curious:
| PA | wOBA | Defense | WAR | |
| Mark DeRosa | 556 | .342 | -.57 | 1.32 |
| Brian Roberts | 630 | .349 | .19 | 2.55 |
Replacing Cedeno with Cintron already pretty much eats away the benefits of a Roberts trade. (I don't know that taking a few hundred at-bats away from Mike Fontenot justifies the deal either, but I still have a little more work to do with the chaining here.)
Labels: Baseball, Brian Roberts, Chicago Cubs, Linear Weights, Mark DeRosa, Projections, Ronny Cedeno, Ryan Theriot, WAR
2008 Cubs Preview, featuring WAR!
4 Comments Published by Colin Wyers on Saturday, February 16, 2008 at 9:02 PM.WAR - what is it good for?
Well, in this case WAR references Wins Above Replacement. Fans, readers and detractors will note the similarity with Wins Above Replacement Player, or WARP. The concept is the same, the internals are different. The full techincal explanation is available at the link; I'll skim over the relevant highlights below.
The short version: you calculate WAR by summing up a player's contributions on the field - pitching for pitchers, offense and defense for position players - converting that to wins, and then comparing those contributions to hypothetical "replacement players," generally defined as the sort of freely-available talent one can acquire for close to the league minimum salary.
[Note: I owe a debt of gratitude to Tangotiger, whose WAR methodology I'm using and who gave some excellent - and necessary - early feedback, and David Cameron, whose post at USS Mariner inspired this.]
First, let's take a look at the hitters:
| Name | PA | wOBA | Defense | WAR | $WAR | Actual$ | Diff. |
| Alfonso Soriano | 621 | 0.371 | 0.57 | 3.53 | 15.95 | 13.00 | 2.95 |
| Ryan Theriot | 542 | 0.312 | -0.10 | 0.69 | 3.46 | 0.40 | 3.06 |
| Derrek Lee | 528 | 0.396 | 0.50 | 3.67 | 16.54 | 13.00 | 3.54 |
| Aramis Ramirez | 582 | 0.385 | -0.19 | 3.77 | 16.99 | 14.00 | 2.99 |
| Kosuke Fukudome | 530 | 0.381 | 0.95 | 3.74 | 16.87 | 12.00 | 4.87 |
| Mark DeRosa | 556 | 0.342 | -0.57 | 1.32 | 6.20 | 5.50 | 0.70 |
| Geovanny Soto | 512 | 0.355 | 0.50 | 3.28 | 14.84 | 0.40 | 14.44 |
| Felix Pie | 536 | 0.328 | 1.43 | 2.56 | 11.68 | 0.40 | 11.28 |
| Daryle Ward | 250 | 0.354 | -1.43 | 0.18 | 1.18 | 1.20 | -0.02 |
| Matt Murton | 275 | 0.357 | 0.29 | 1.13 | 5.39 | 0.40 | 4.99 |
| Ronny Cedeno | 275 | 0.331 | -0.10 | 0.79 | 3.86 | 0.40 | 3.46 |
| Mike Fontenot | 275 | 0.317 | -0.29 | 0.20 | 1.26 | 0.40 | 0.86 |
| Henry Blanco | 188 | 0.301 | 0.50 | 0.36 | 2.00 | 2.75 | -0.75 |
| Sam Fuld | 250 | 0.307 | -0.10 | 0.22 | 1.35 | 0.40 | 0.95 |
| Eric Patterson | 225 | 0.322 | -1.00 | 0.02 | 0.50 | 0.40 | 0.10 |
| Total | 6145 | 0.346 | 0.98 | 25.47 | 118.08 | 64.65 | 53.43 |
Plate appearances shouldn't require much explanation. In this case, I apportioned out most of the playing time for the Cubs on offense; playing time not accounted for here is assumed to be replacement level.
wOBA is Weighted On-Base Average, essentially a rate stat version of Linear Weights. Functionally it works just like Equivalent Average, except on the OBP scale instead of the batting average scale; .340 is (generally) league average. These wOBA figures are based on the CHONE projections, available from Sean Smith's website. wOBA, being a linear weights equation, can be easily converted to runs, and thus wins, above average.
Also available there are defensive projections, which form the basis for my defensive figures. (I made manual adjustments for Lee, Blanco, Fukudome, Pie and Soto.) Smith (and any plus/minus system) rates defenders in terms of plays or runs (in this case, runs) saved compared to average at the position. To convert runs to wins, simply divide by 10.5.
Okay, now here's the secret sauce that lets us compare these players across positions. In the National League, the average player is two wins above replacement, so everyone above gets credit for those two wins.
Players also get credited (or debited) wins for what position they field:
+1.0 C
+0.5 SS/CF
+0.0 2B/3B
-0.5 LF/RF/PH
-1.0 1B
-1.5 DH
This is because a league-average hitter who plays catcher is more valuable than a league average hitter who can only play first base or designated hitter.
Combine those elements, and you get a player's WAR. $WAR is simply the cost value of those wins on the free agent market (the formula assumes that a team pays $4.4 million per win on the free agent market, which has held up pretty well for the 2008 offseason). Actual$ is, well, the player's 2008 contract. Difference is how much surplus value that player is providing; if you've ever sat there and wondered how much Henry Blanco is overpaid, well, now you know.
One thing that pops out at me is how the severe backloading of the contracts means that the salary for players like Ramirez and Soriano are actually very reasonable right now. There's a whole lot of risk wrapped up into the back ends of those contracts, though.
Now, for the pitchers:
| Name | IP_Start | IP_Relief | ERA | WAR | $WAR | Actual | Diff. |
| Carlos Zambrano | 212 | 0 | 3.84 | 4.06 | $18.28 | $15.00 | $3.28 |
| Ted Lilly | 188 | 0 | 4.24 | 2.66 | $12.10 | $7.00 | $5.10 |
| Rich Hill | 186 | 0 | 3.91 | 3.40 | $15.35 | $0.40 | $14.95 |
| John Lieber | 134 | 0 | 4.61 | 1.31 | $6.16 | $3.50 | $2.66 |
| Jason Marquis | 89 | 25 | 5.08 | 0.27 | $1.61 | $6.40 | -$4.79 |
| Sean Gallagher | 83 | 0 | 4.96 | 0.49 | $2.55 | $0.40 | $2.15 |
| Sean Marshall | 60 | 20 | 4.62 | 0.57 | $2.92 | $0.40 | $2.52 |
| Kevin Hart | 0 | 28 | 5.26 | -0.20 | -$0.49 | $0.40 | -$0.89 |
| Neal Cotts | 0 | 20 | 3.94 | 0.16 | $1.09 | $0.80 | $0.29 |
| Kerry Wood | 0 | 65 | 4.25 | 0.26 | $1.55 | $4.20 | -$2.65 |
| Carlos Marmol | 0 | 72 | 3.85 | 0.65 | $3.26 | $0.40 | $2.86 |
| Ryan Dempster | 0 | 72 | 4.18 | 0.35 | $1.95 | $5.50 | -$3.55 |
| Michael Wuertz | 0 | 72 | 3.55 | 0.94 | $4.52 | $0.86 | $3.66 |
| Bob Howry | 0 | 74 | 3.46 | 1.05 | $5.02 | $4.00 | $1.02 |
| Scott Eyre | 0 | 57 | 4.11 | 0.33 | $1.84 | $3.80 | -$1.96 |
| Total | 952 | 505 | 4.26 | 16.30 | $77.72 | $53.06 | $24.66 |
Let's start off discussing the innings pitched. It's easier to pitch as a reliever than it is as a starter; usually a pitcher who does both will have a lower ERA as a reliever. So we need to use different replacement baselines for starting and relieving; I've designated two pitchers as "swingmen," Jason Marquis and Sean Marshall. I'm sure some of you are chuckling at that - I happen to be pessimistic about what Marquis can achieve this season and think Lou will pull him from the rotation when things get too bad.
Innings pitched adds up to 1457; there's roughly 1458 innings in a season, which changes because of extra-inning games and home halves of the ninth inning skipped when the home team leads.
ERA is based off several projections, with CHONE getting more weight than the others, mostly because it was handier; beyond that some of it was simply my personal preference. These figures have been revised upwards to make them "defense neutral," since we already gave the position players credit for defense above. (Technical explanation: I calculated FIP ERA for the CHONE projections and used that as a baseline.)
WAR is a function of runs allowed compared to replacement, converted to wins using the Pythagenpat method, a refinement of the Pythagorean theorum.
Just take a gander at the difference between what the Cubs are paying Hill and what he would be worth on the free agent market. (And that's ignoring the fact that teams generally will overpay for pitching wins.) That's why, in case you were wondering, the people advocating for a Hill-for-Bedard trade were being, at best, shortsighted. Bedard may well be a better pitcher, but because of his many remaining cheap years, Hill is insanely more valuable.
And just look at how overpaid our bullpen is; Howry is our only free agent reliever expected to provide value up to his contract.
Now, what I have failed to do is assign a "premium" to the closer for leverage; this is because nobody knows who the hell our closer is. I did play around with it for a bit, and: hey, we lose a whole win by making Dempster the closer as opposed to a middle reliever. That's a pretty drastic difference for a relief pitcher.
Add up our position player WAR and our pitching WAR, and we get 42 wins above replacement; a team composed of entirely replacement level players would be expected to win about 50 ballgames. So, given the assumptions I used, you could say the Cubs look like about a 92 win team. That's based on some optimistic assumptions involving the starting rotation (namely that Marquis gets dumped from it before too long, and Dempster is never used in it). I plan on redoing this little exercise again several times during spring training, as the final roster spots shore up and we get a better idea of how the rotation and bullpen shake up.
The full spreadsheet used, in all its glory, is available for your perusal on EditGrid. You can also download it to your computer as an Excel file and play around with it. Don't like my assumptions? Change them! Have fun with it. Let me know what results you get.
Labels: Baseball, Chicago Cubs, Linear Weights, Projections, WAR