There are two breeds of vanilla, free-as-in-beer zone rating available in the world: STATS and BIS. I already have a dumb projection system for STATS ZR, which could be refined (aging curves and speed/tools scores are the two major refinements I’m musing over.)
But first I wanted to introduce BIS’s RZR into it. And therein lies a dilemma, folks. Here’s the averages for RZR and OZR (OOZ divided by BIZ) over the years available at The Hardball Times:
| POS | YEAR | Plays | OOZ | BIZ | RZR | OZR |
| 1B | 2004 | 4070 | 1783 | 5406 | .753 | .330 |
| 1B | 2005 | 4343 | 1940 | 5493 | .791 | .353 |
| 1B | 2006 | 3877 | 2012 | 4851 | .799 | .415 |
| 1B | 2007 | 4963 | 1048 | 6695 | .741 | .157 |
| 1B | 2008 | 2871 | 847 | 3815 | .753 | .222 |
| 1B | Total | 20124 | 7630 | 26260 | .766 | .291 |
| 2B | 2004 | 9863 | 1203 | 12129 | .813 | .099 |
| 2B | 2005 | 10403 | 1478 | 12825 | .811 | .115 |
| 2B | 2006 | 10401 | 1211 | 12679 | .820 | .096 |
| 2B | 2007 | 10120 | 1412 | 12192 | .830 | .116 |
| 2B | 2008 | 6313 | 649 | 7693 | .821 | .084 |
| 2B | Total | 47100 | 5953 | 57518 | .819 | .103 |
| SS | 2004 | 9872 | 1919 | 11995 | .823 | .160 |
| SS | 2005 | 10484 | 1948 | 12821 | .818 | .152 |
| SS | 2006 | 10809 | 1659 | 13218 | .818 | .126 |
| SS | 2007 | 10625 | 1912 | 13019 | .816 | .147 |
| SS | 2008 | 6353 | 999 | 7627 | .833 | .131 |
| SS | Total | 48143 | 8437 | 58680 | .820 | .144 |
| 3B | 2004 | 6215 | 2074 | 9007 | .690 | .230 |
| 3B | 2005 | 6813 | 2396 | 9271 | .735 | .258 |
| 3B | 2006 | 7686 | 1636 | 10880 | .706 | .150 |
| 3B | 2007 | 7221 | 1717 | 10623 | .680 | .162 |
| 3B | 2008 | 4444 | 1003 | 6344 | .701 | .158 |
| 3B | Total | 32379 | 8826 | 46125 | .702 | .191 |
| CF | 2004 | 9478 | 2034 | 11905 | .796 | .171 |
| CF | 2005 | 10266 | 1963 | 12590 | .815 | .156 |
| CF | 2006 | 10316 | 2002 | 11534 | .894 | .174 |
| CF | 2007 | 10886 | 1944 | 12264 | .888 | .159 |
| CF | 2008 | 5922 | 1583 | 6468 | .916 | .245 |
| CF | Total | 46868 | 9526 | 54761 | .856 | .174 |
| LF | 2004 | 7710 | 847 | 12242 | .630 | .069 |
| LF | 2005 | 8686 | 718 | 13712 | .633 | .052 |
| LF | 2006 | 7723 | 1634 | 8971 | .861 | .182 |
| LF | 2007 | 8014 | 1614 | 9373 | .855 | .172 |
| LF | 2008 | 4475 | 1076 | 5060 | .884 | .213 |
| LF | Total | 36608 | 5889 | 49358 | .742 | .119 |
| RF | 2004 | 8736 | 781 | 13442 | .650 | .058 |
| RF | 2005 | 9181 | 695 | 14161 | .648 | .049 |
| RF | 2006 | 8376 | 1686 | 9436 | .888 | .179 |
| RF | 2007 | 8418 | 1575 | 9597 | .877 | .164 |
| RF | 2008 | 4802 | 1205 | 5321 | .902 | .226 |
| RF | Total | 39513 | 5942 | 51957 | .760 | .114 |
(2008 numbers will be slightly different from Studes’ numbers, as these are a few days old.) The projections for infielders are doable. But, as it stands, those outfield numbers are a horror show, taken by themselves.
So before we can make projections based upon RZR data, we first need to normalize it. I’m sure there are better ways than the one I’m using, but I don’t think I’m using the worst way either and it’s very expedient for my needs.
What I’m doing is dividing Plays, OOZ and BIZ by the totals for that season, and then multiplying by the averaged totals of all five years.
And, since I was rather short with the explanation the last time out, I’ll go ahead and spell out what I’m doing in full:
- First, as above, every player’s performance is “normalized” to an average of the past five seasons.
- Then, a weighted average of their past four seasons (05-08) is taken, with the most recent season being given a weight of 5, then 4, then 3, then 2.
- Two weights worth of a full season’s average defensive performance of the season is added as a regression to the mean component.
- 5 + 4 + 3 + 2 + 2 = 16, so everything gets divided by 16. I wouldn’t exactly call it a playing time projection, but it’s a rough guide to how much playing time a player might be expected to receive.
- Plays and Runs above average are figured for a full season’s performance, given the number of chances of the average player at that position from 04 through 08.
And… here are the projections. You can compare them to the STATS ZR projections, if you’d like.
(Note: Currently only players with a Baseball Databank ID who have appeared in 2008 are included in either projection set. The next step is to take the rest of the players in the RZR set, map them to the appropriate STATS ID, and run both projections side by side for all players who played in 2008, and maybe some who haven’t yet but could.)
So what’s next? Like I said before, these could really benefit from aging curves. (While I’m on the topic, Jon Shepherd over at Camden Depot has published RZR aging curves which are worth taking a look at. I have my own ZR aging curves which I should really try and get straightened out.) I really should probably run “projections” for seasons past and see how they match up with what actually happened.
And I want to work on combining data from multiple positions; I’ve done some comparisons of players who have played multiple positions, and my feeling from looking at the data is that in projecting a player’s zone rating, there really isn’t a lot of difference in difficulty in playing the different outfield positions – it’s not really much harder to catch fly balls in center field than it is anywhere else, but there’s a lot more fly balls to catch and so a good fielder is worth a lot more. But that’s worth exploring more, and there are some noteworthy sampling issues in that data; I find it hard to believe that a center fielder is below average as a first baseman defensively, for example. I should rerun this query on the RZR dataset here soon, see what that looks like.
Labels: Defense, Projections
So, you want to talk about a player’s defense?
Remember: a good sabermetrician is like a good hunter when cleaning his kill: he throws away as little as possible, taking care to use most of the animal. We have decades of information about players; why should we ever use only three and a half months worth of data in evaluating a player?
My process is based heavily off of Tango’s Marcels forecasting system; that said, he had nothing to do with this, and screwups in it are mine, not his. (For background on how a projection system works, here’s a decent writeup. If I don’t say so myself.)
Before going any further, I should note that I made this in about two hours. And I also made dinner in those two hours. And I had a side dish. So don’t expect anything on the order of PECOTA as far as complexity goes.
Here’s how it works. Every player’s zone rating data from 2005-2008 (yep, everything pre-All Star break from this year) is thrown into a mixer and weighted. I used a 5/4/3/2 weighting; I have no empirical basis for these weights other than it’s what Marcel uses. Then throw in two season’s worth of the league average for the position. There’s your regression to the mean.
Aging curves are… forthcoming. Maybe. I’m still hashing out the details. (I’ve started work on zone rating based aging curves for fielders, but there are questions about how accurate they are, and before they can be used in a projection system they need to be smoothed out a bit more.)
So, data. Plays and runs above or below average are figured using the Dial method. For that, each player is assumed to have a full season’s worth of chances at the position, not the number of chances used to compute zone rating.
The next step beyond aging curves would probably be to incorporate at least some measure of speed scores into the projection. But I was hungry, and so instead you have the best projection system I could make in two hours, while still making dinner. It’s a start, at least.
(Also, lemme take this chance to plug my hitter and pitcher evaluations on GROTA, if you have an interest in such things regarding the Cubs. Hitter and pitcher projections are next on my plate.)
Labels: Defense, Projections
What’s a shortstop made of?
0 Comments Published by Colin Wyers on Sunday, June 22, 2008 at 2:15 PM.
UPDATE: Please to disregard this for now. I've discovered an issue with the IDs in the zone rating database. I'm working on fixing the issue, but until then, this is fraught with issues. My sincerest apologies for the error.
Tango’s Fan Scouting Report tells us something that we can’t tell from the stats alone – what physical tools and skills a player has. But does that tell us anything meaningful? I hooked up the Fan Scouting Report to a database of STATS, Inc. zone rating. (Shamefully, I eliminated all players with fewer than 30 in zone chances.)
I want to note right off the bat that I'm puttering here, just poking the data with a stick. Do not take this as gospel.
Here's a set of scatterplots between each of the individual tools assessed and zone rating:

I’ll also present the correlations – the dotted lines, if you were wondering – as a table:
OVERALL | INSTINCTS | FIRSTSTEP | SPEED | HANDS | RELEASE | ACCURACY | STRENGTH | ZR | |
OVERALL | 1.000 | 0.953 | 0.898 | 0.706 | 0.885 | 0.905 | 0.817 | 0.651 | 0.280 |
INSTINCTS | 0.953 | 1.000 | 0.856 | 0.626 | 0.838 | 0.850 | 0.741 | 0.580 | 0.288 |
FIRSTSTEP | 0.898 | 0.856 | 1.000 | 0.846 | 0.660 | 0.674 | 0.551 | 0.576 | 0.250 |
SPEED | 0.706 | 0.626 | 0.846 | 1.000 | 0.402 | 0.424 | 0.306 | 0.522 | 0.137 |
HANDS | 0.885 | 0.838 | 0.660 | 0.402 | 1.000 | 0.931 | 0.869 | 0.411 | 0.286 |
RELEASE | 0.905 | 0.850 | 0.674 | 0.424 | 0.931 | 1.000 | 0.920 | 0.468 | 0.299 |
ACCURACY | 0.817 | 0.741 | 0.551 | 0.306 | 0.869 | 0.920 | 1.000 | 0.424 | 0.289 |
STRENGTH | 0.651 | 0.580 | 0.576 | 0.522 | 0.411 | 0.468 | 0.424 | 1.000 | 0.024 |
ZR | 0.280 | 0.288 | 0.250 | 0.137 | 0.286 | 0.299 | 0.289 | 0.024 | 1.000 |
Arm strength doesn’t seem to correlate well with zone rating – in fact it has the lowest correlation of any of the tools - which surprised me at first. It doesn’t make sense that having a better arm doesn’t make you a better shortstop. But before you go throwing out the analysis as piece of lunacy, give me a second.
In the center is a histogram of each graph. We’ll go ahead and zoom in for a detail. First, overall (average of all tools):

It tilts just a shade to the right, but for our sample it seems to do a pretty good job of fitting to a standard “bell curve” shape. Now, look at the histogram for arm strength:

See how it bunches together? (Unfortunately, R takes the number of groups in a histogram as a suggestion rather than as a hard-and-fast rule, or the graphs would be a little easier to compare.)
If we were to look at how well all baseball players did defensively at shortstop, we’d likely find that arm strength matters a great deal. But looking at players selected to play shortstop, it’s a different story; anyone who doesn’t have the arm for the position has been weeded out, and knowing a player’s arm strength gives us little additional information.
Of course, we’re barely scratching the surface with this. More reading is available here and here, for starters.
Labels: Defense
How good of a shortstop is a second baseman?
4 Comments Published by Colin Wyers on Friday, June 20, 2008 at 10:54 AM.
UPDATE: Please to disregard this for now. I've discovered an issue with the IDs in the zone rating database. I'm working on fixing the issue, but until then, this is fraught with issues. My sincerest apologies for the error.
I’ve been doing a lot of thinking about replacement level and positional adjustments recently; about the only thing I learned from that was that Gary Gaetti was the biggest free agent bargain of the past 20 years. That’s not very useful, I know.
But it got me thinking about the relative value of different positions. Consider this table, based off of Chris Dial’s excellent work:
| POS | LG_ZR | ZR_CH | ZR_RUNS |
| 1B | .844 | 281 | .798 |
| 2B | .825 | 507 | .754 |
| 3B | .753 | 430 | .800 |
| SS | .843 | 532 | .753 |
| LF | .868 | 348 | .831 |
| CF | .884 | 462 | .842 |
| RF | .872 | 365 | .843 |
Lemme ‘splain – LG_ZR is the average zone rating (plays divided by chances) at the position. [I derived those values from SG’s zone rating database; everything else in the table is straight from Dial.] ZR_CH is the average number of chances in a season at the position. ZR_RUNS is the average value in runs at the position.
Each of those measures different things; Zone Rating itself measures the difficulty of making a play. Chances and runs, on the other hand measures leverage of that skill. Tango has done some great work in this area in the past, but at the runs level. That's fine for measuring value, but I'm going to look at it from a different perspective.
Right now, all I have is data for players who were at both second and short for the same team in the same season. (Well, at least, that's all the data I've looked at and processed.) Here’s the data, if you're interested.
Here's what I did - I took a weighted average of each player's numbers (plays made and chances) at each position, using the number of chances as the weight. For all players, the number of chances used as the weight comes from the position where the player had the fewest number of chances. Then, I calculated zone rating from the weighted averages. (From here on out, when I say average I'm referring to a weighted average, except for the league average.)
The average zone rating of a shortstop in our sample pool is .836, compared to .843 for the league. So the players that play both positions tend to be below-average shortstops. Makes sense, right? For second basemen, it's .827, compared to .825 for league. So second basemen who play shortstop are (slightly) above-average second basemen, according to our sample. Again, this makes sense, but the difference is small enough that it's probably not worth considering.
Now, here's the conclusion that doesn't seem to make sense on the face of it: players in our sample pool are making more plays per opportunity at shortstop, compared to second base. All this means is that, for a shortstop, it's easier to make a play on a ball at short than it is to make a play on a ball at second.
There is a selective sampling issue here: the players in our pool, by and large, have the physical tools to play shortstop; there are many second basemen who don't posses those tools, which largely comes down to arm strength. From any of the available data - zone rating, Retrosheet play-by-play, etc. - it's, as far as I can tell, impossible to tell who those players are. [We do have that data available from Tango's Fan Scouting Report. That's the next obvious avenue of approach for studying this issue.]
I also split my sample into two groups - players that played mostly at shortstop and players that played mostly at second base. There wasn't a large difference between the two groups that I noticed.
The difference between the average second baseman playing shortstop (which is pretty close to the average second baseman overall) is about four plays or three runs over a full season. Again - this is for players who teams selected based on their ability to play shortstop. The difference between our shortstops-at-second and the league second baseman was only one play; bear in mind that these are below-average shortstops to begin with.
My hunch is that the best way to do a conversion factor for a player, assuming that he's able to play shortstop at all, is to use a multiplier to convert plays per chance between positions. I'll have to look into that - and, again, the next step is to look at physical tools using the Fan's Scouting Report.
Labels: Defense
I'm way behind on working with the Enhanced Gameday hit location data - I'm working on adding the 2005, 2006 and 2008 seasons to the database, as well as trying to figure out if I can parse some extra data out of the 2008 data.
I'm also trying to create a defensive rating metric based upon the data, similar to the SAFE metric. I'm pretty comfortable with converting everything to vectors at this point, and have a rough idea about how to handle the smoothing function. Mostly at this point it's learning enough about R to actually do the implementation.
For those wondering about the accuracy of this data, it's not as good as the datasets from STATS, Inc. or BIS. I found an article comparing the various hit location datasets.
In the meantime, I've started doing some work with outfielders for the other site I blog at. The good news is that I've got the routines I use to make the plots much more automated than I did in the past, and so I can crank out plots a lot quicker now. If anyone has a particular fielder they're interested in - infield or outfield - let me know.
Labels: Baseball, Defense, Enhanced Gameday
Looking for defensive shifts, part II
1 Comments Published by Colin Wyers on Wednesday, April 30, 2008 at 10:36 PM.
Last night, I went looking for defensive shifts. Well, here they are, broken down by base/out state and batter handedness:

There may be special cases, like the wishbone shift, but I think that's pretty representative of how fielders position themselves. (If you want the underlying data, here it is.)
It's hard to read the graph without looking at the accompanying data - the fielders don't always shift in the same direction on any given shift. Random thoughts based on a cursory reading of the data:
- Corner infielders tend to shift more than middle infielders. (As a measure of distance, that is.)
- For corner infielders, most shifts involve depth; most middle infielder shifts involve lateral movement.
- There's no small amount of noise to that graph; if I was going to use this sort of data for a project (say, determining responsibility for a ground ball in a zone rating type of system) I'd want to smooth it out into, say, maybe three or four different positionings per position. (Just eyeballing it real quick, for first base there seems to be three basic positionings - base empty, runner on first, and playing the bunt. Same for third base.)
- A lot of people were asking if having a good defensive third baseman could "cut into" a shortstop's graph, making his range look smaller than it really was. I have a hunch that we might be able to find out exactly how much third basemen are cutting into the shortstop's area of responsibility if we look at how much the shortstop's range grows when the third baseman is playing in.
My next project is going to be to figure out a way to estimate how many "chances" a player has at a position from the hit location data. (I haven't really done anything with it yet, but I have hit location data for balls hit into the outfield as well.) It's far less a conceptual problem than it is a judgement and labor problem - I have a good idea of how I want to delineate the zones of responsibility. The question is now how big to make the zones; then I have to actually go and write the code.
Labels: Baseball, Defense, Enhanced Gameday
Looking for defensive shifts
0 Comments Published by Colin Wyers on Tuesday, April 29, 2008 at 11:14 PM.
Continuing with making defensive graphs, I thought it might be illuminating to try and see exactly how much defensive positioning impacts where ground balls are fielded. The following are graphs of the average location of a fielded ground ball, color-coded by position.
First off, every ball in the data set:

Makes sense, I suppose. We'll call that our reference graph.
Now, let's take a look at just right handed batters with the bases empty:

Virtually identical - everybody plays "straight-up" in that situation. But now let's look at the same situation with a left-handed batter:

It's a subtle shift, but a shift nonetheless. The middle infielders seem to "cheat" a bit to their left, and the third baseman seems to be doing a heck of a lot of cheating, not only over but shallow.
Now, with a runner on first (second and third empty):

Everybody but the first baseman seems to play straight up - the first baseman plays a lot shallower, though. With runners on first and second:

That looks pretty much like our reference graph - maybe the third baseman's playing a little in, but other than that everyone is playing straight up. With the bases loaded:

Looks like everyone is playing straight up. Now, let's take a look at how fielders position themselves when a handful of lefty sluggers (Thome, Ortiz, Fielder, Giambi and Hafner) are at bat:

That's the wishbone shift, and I'm really pleased that the graph is capturing it so well.
The next step is to look at the number of outs in the inning and see how that affects defensive positioning. (Unless something else shiny distracts me first.)
Labels: Baseball, Defense, Enhanced Gameday
Derek Jeter vs. Troy Tulowitzki
8 Comments Published by Colin Wyers on Friday, April 25, 2008 at 11:32 PM.
An extension of last night's fun with graphing.

I'm not saying. I'm just saying.
Labels: Baseball, Defense, Derek Jeter, Enhanced Gameday
Can we measure a fielder's range?
0 Comments Published by Colin Wyers on Thursday, April 24, 2008 at 11:45 PM.
First of all, let's define range as a fielder's ability to get to baseballs. For the purposes of this analysis, we don't care what a fielder does with the ball when he gets to it. We're only interested in how far he can go to get to a baseball.
Pretty much any defensive metric you see that attempts to measure range is really an approximation based upon the data available. The more data we have, the better (play-by-play data is better than seasonal totals; zone rating is even better) but the best thing would be to know:
- Where the ball was fielded, and
- Where the fielder was standing where the ball was hit.
I am unaware of anyone who keeps track of #2, but there are several outlets that keep track of #1. MLB.com keeps track of it for their Enhanced Gameday functionality. MLB Advanced Media, at least currently, makes that data available to researchers. Most commonly it's used in PitchF/X analysis, but for right now I'm just using the hit location data.
Rather than parse the remainder of the data I needed from the verbatim description (which is something I'd love to start doing, but let's just say that regular expressions scare me) I merged the hit location data with the Retrosheet play-by-play data. (The boilerplate: The information used here was obtained free of charge from and is copyrighted by Retrosheet. Interested parties may contact Retrosheet at 20 Sunset Rd., Newark, DE 19711.) Dan Turkenkopf has a great parser that links the Gameday XML files up with the appropriate Retrosheet IDs. A few SQL queries later, and bingo, data! I filtered for all ground balls and divided them up by what position was responsible for fielding them. The result of the play (hit, error or out) was also recorded, although not used in the presentation here.
But what to do with the data? I decided to try plotting it with GNU R, a free statistics and graphing programming tool. The basics of this are covered in Baseball Hacks, by Joseph Adler. Additional functionality is provided by the Geneplotter library.
Okay, here we go - plots!
First base:

Second base:

Shortstop:

Third base:

Those are our reference images - all fielders from 2007 are included. Now, let's take a look at a handful of shortstops, just to see how a few different players look.
Troy Tulowitzki:

Adam Everett:

Derek Jeter:

Ryan Theriot:

I'll be the first to admit - if it wasn't nearly 2 in the morning, I would spend a little more time on cleaning up these graphs. The pitches right on the edges seem a bit more difficult to "read," for one. And I don't really need the entire field like that for just infielders - we can do the same thing with outfielders, I just haven't yet.
I'm just "doodling" with the data for now - if there is quantitative analysis to be done with this data, it'll have to wait at least until morning. I would love to put that Tulo graph next to that Jeter graph and show it to a bunch of Yankees fans, see what they have to say about it. Suggestions and requests are welcome.
Labels: Baseball, Defense, Enhanced Gameday
With and without Aramis Ramirez
1 Comments Published by Colin Wyers on Monday, April 21, 2008 at 11:31 AM.
Consider this a lark with data; I wouldn't consider the conclusions definitive, or even necessarily meaningful. It's at least thought provoking.
First, I cobbled together a fascimile of a zone rating system based upon the work of Sean Smith on TotalZone. Let me be clear here: my zone rating system is probably the worst zone rating system in existence. If you want a Zone Rating system based on Retrosheet data, TotalZone or SFR are vastly superior; UZR and PMR are better still. And my system - let's call it SZR, for "Stupid Zone Rating" - only rates shortstops, making it even more, well, stupid. Or "special," if you're worried about hurting its feelings.
Here's how it works:
- Shortstops are given credit every time they record an out or fielder's choice on a ground ball.
- An "opportunity" to make a play is assigned for errors, and half of all ground ball singles hit to left and center field.
Stupid Zone Rating is simply Outs divided by Outs plus Opportunities.
So why invent the worst possible zone rating system? Because it lets me play around with the data a bit. In this specific case, what I wanted to know was simple. Aramis Ramirez had easily the best defensive season of his career last season. He also missed no small amount of playing time, which gives us a healthy amount of "non-Aramis" opportunities to compare to.
What I was curious about was, did A-Ram's big defensive season have an effect on the Cubs shortstops?
The average SZR of a shortstop from 2004-2007 was .766. During that time, the average SZR of Cubs shortstops when Ramirez didn't play was .801; when Ramirez played, the average SZR of Cubs shortstops was .761.
Now, we'll drill down to 2007. When Ramirez played in 2007, Cubs shortstops averaged a .762 SZR; when Ramirez was out of the lineup, the Cubs averaged a .797 SZR.
I have to go to my actual paying job now, so I'll leave figuring out what that data means as an exercise to the reader. The full spreadsheet is available to peruse.
(The information used here was obtained free of charge from and is copyrighted by Retrosheet. Interested parties may contact Retrosheet at 20 Sunset Rd., Newark, DE 19711.)
Labels: Aramis Ramirez, Baseball, Chicago Cubs, Defense, Mark DeRosa, Ronny Cedeno, Ryan Theriot
2008 Cubs Opening Day Roster, by WAR
10 Comments Published by Colin Wyers on Wednesday, March 26, 2008 at 11:23 PM.
Hitters only. Let's get straight to the bidness:
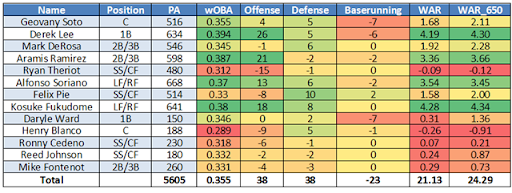
Someday I'll look into actually putting these charts together in a more interactive format, but Excel outputs such awful HTML, and I really don't feel like messing with it myself at this point. (EditGrid and Google Docs don't support the fancier formatting, either.)
If you're late to the party, I explain WAR in a previous post. WAR stands for Wins Above Replacement, and it measures a player's overall contribution to team wins. WAR_650 is a new stat that prorates WAR out to 650 plate appearances. Offensive production is now park adjusted as well. [An updated version of the WAR calculator should be ready for release here soon, incorporating these refinements.]
These are all based on projected stats. For offense and wOBA, I made a composite of:
- The Bleed Cubbie Blue community projections
- PECOTA
- CHONE
- ZiPS
- Marcels
Defense is based on Sean Smith's defensive projections. Baserunning projections are very crude, and involve a bit of Kentucky windage; they're based on my baserunning metrics.
Things to draw from the chart:
- The Cubs look to have a very fine offense this season.
- They look to have a very good defense again.
- They're miserable at running the bases.
- I love to color-code things.
- Ryan Theriot sucks.
So, basically, nothing you didn't already know. I hope to get around to the pitchers by opening day, but no promises.
Labels: Baseball, Chicago Cubs, Defense, Projections, WAR
One of the things that seems to escape people about Bill James in particular, and "sabermetricians" in general, is that it's not necessarily about the numbers, but about what the numbers mean - the numbers are a tool, not the objective.
So what's the objective? To come up with the Truth - the truth about baseball. Honest-to-God objective truth. To do that, we need to use statistics - but those are just some of our tools. Better, clearing thinking doesn't necessarily need to be expressed in numbers to have power.
One concept of James that wasn't necessarily a statistic - but very much a part of sabermetric thinking - was the defensive spectrum. Simply put, some positions are harder to play than others. And players tend to move in one direction along the spectrum much more frequently than they do the other.
So it occurred to me the other day while doing the dishes that, as there are seven positions on the defensive spectrum, there are seven colors on the "traditional" spectrum. (Separating Indigo and Violet is cheating, but whatever.) So I color-coded the positions, and sorted them in the graph you see below according to runs saved. I used Sean Smith's Combined Zone Rating for reasons I can't really articulate. My defensive spectrum is backward - I have shortstops all the way on the left and first basemen all the way on the right. (Or I would, if there weren't some third basemen and left fielders determined to make it over there.) And I promoted center fielders to second on the spectrum, at the expense of second basemen.
These aren't the raw numbers - I gave everyone a positional adjustment, same as I use for calculating WAR. Same positional adjustments, actually. And I narrowed it down to 250 players, because of limitations in Excel and the roundabout way that I made the chart. I simply selected the players with the most balls in zone. And here it is:
Is this meaningful? Useful? I have no earthly idea. The Zone Rating data I used is hardly the best defensive metric out there, although it may have been the best I had available in a convenient spreadsheet form for all of 2007. (PMR doesn't come in a convenient spreadsheet, and full 2007 UZR is not yet available.)
And all the usual caveats apply. There are things that Zone Rating doesn't capture to defense - throwing ability for outfielders, the double play for infielders, receiving skills for first basemen. And there are specific elements to fielding certain positions that the defensive spectrum doesn't capture - arm strength for right fielders versus left or center fielders, for example. Or handedness: left handers are generally kept from playing short, second or third - all of them premium defensive positions.
But I find it fun to look at, at least. Consider this to be me thinking aloud.
People often say, "You can't have an All Star at every position!" Know this (tattoo it on yourself where you'll see it if you think you'll forget): any time this is brought up, you're talking about a crappy ballplayer. I mean, seriously. Nobody starts off conversations about good ballplayers that way. It's some sort of red flag that people want to keep a baseball player on the field for non-baseball reasons.
Apply that sort of thinking to your everyday life. Say your kid brings home a report card with an F on it. How would you react if he said, "You can't have an A+ in every class!" Or say your spouse is responsible for making dinner and sets it (and the kitchen) ablaze. "You can't have filet mignon at every meal!"
I'm not asking for straight As, and I'm not asking for fancy French cooking. I'm asking for the shortstop equivalent of a C, or some chili macaroni Hamburger Helper. I'm looking for average. It's a total straw man argument.
To go ahead and illustrate my point, I've compiled a list of what I've supposed to be the starting shortstops for every team in the majors, and calculated Wins Above Replacement using Sean Smith's projections. [In the case of the Angels and the Nationals, I've used two shortstops.] I've also included perpetual Cubs fan favorite, the Great Destroyer himself, Ronny Cedeno.
I held playing time constant for all players, and have not used any park adjustments. Both of those (false) assumptions would tend to favor Ryan Theriot in comparison to other shortstops.
Cubs players are in bold.
| Name | Team | League | wOBA | Defense | WAR |
| Troy Tulowitzki | COL | NL | 0.356 | 14.00 | 4.06 |
| Miguel Tejada | HOU | NL | 0.373 | 0.00 | 3.74 |
| Jose Reyes | NYM | NL | 0.349 | 6.00 | 2.98 |
| Jimmy Rollins | PHI | NL | 0.355 | 2.00 | 2.95 |
| Jason Bartlett | TBA | AL | 0.32 | 13.00 | 2.50 |
| Hanley Ramirez | FLA | NL | 0.375 | -17.00 | 2.35 |
| JJ Hardy | MIL | NL | 0.348 | -1.00 | 2.31 |
| Adam Everett | MIN | AL | 0.283 | 31.00 | 2.10 |
| Derek Jeter | NYA | AL | 0.358 | -15.00 | 2.07 |
| Khalil Greene | SDN | NL | 0.33 | 7.00 | 2.05 |
| Jhonny Peralta | CLE | AL | 0.345 | -8.00 | 1.99 |
| Jack Wilson | PIT | NL | 0.327 | 7.00 | 1.88 |
| Michael Young | TEX | AL | 0.352 | -14.00 | 1.84 |
| David Eckstein | TOR | AL | 0.323 | 3.00 | 1.78 |
| Edgar Renteria | DET | AL | 0.33 | -2.00 | 1.71 |
| Rafael Furcal | LAN | NL | 0.331 | 1.00 | 1.57 |
| Macier Izturis | LAA | AL | 0.333 | -6.00 | 1.52 |
| Yunel Escobar | ATL | NL | 0.34 | -6.00 | 1.43 |
| Orlando Cabrera | CHA | AL | 0.323 | -1.00 | 1.43 |
| Alex Gonzalez | CIN | NL | 0.323 | 4.00 | 1.40 |
| Ronny Cedeno | CHN | NL | 0.331 | -1.00 | 1.40 |
| Stephen Drew | ARI | NL | 0.339 | -6.00 | 1.38 |
| Julio Lugo | BOS | AL | 0.321 | -3.00 | 1.14 |
| Bobby Crosby | OAK | AL | 0.306 | 6.00 | 1.13 |
| Omar Vizquel | SFN | NL | 0.302 | 10.00 | 0.80 |
| Ryan Theriot | CHN | NL | 0.312 | 1.00 | 0.55 |
| Yuniesky Betancourt | SEA | AL | 0.312 | -5.00 | 0.48 |
| Tony Pena | KCA | AL | 0.279 | 10.00 | 0.03 |
| Cesar Izturis | SLN | NL | 0.295 | 2.00 | -0.28 |
| Christian Guzman | WAS | NL | 0.31 | -9.00 | -0.45 |
| Felipe Lopez | WAS | NL | 0.316 | -13.00 | -0.48 |
| Erick Aybar | LAA | AL | 0.288 | -10.00 | -1.25 |
| Luis Hernandez | BAL | AL | 0.268 | 1.00 | -1.36 |
So, when I say that almost anybody would be an improvement on Ryan Theriot, I'm not exaggerating or showing some sort of bias against scrappy white guys. He's not the worst starting shortstop in the majors, but he's not too far away.
Now, obviously this is based upon projections of performance, and those projections could be wrong. The projections on offense are probably more reliable than the projections on defense. But that's as true for Troy Tulowitzki as it is for Luis Hernandez. Unless you have a specific reason that the projections are underrating Ryan Theriot relative to the other shortstops in baseball, I don't see a reason to think he'll be very good for the Cubs next year.
He's an average defender at shortstop - he's got sure hands, even if his range isn't very good; not a butcher like Michael Young or Hanley Ramirez, but not a solid defender like Troy Tulowitzki or Omar Vizquel. At the same time he's not a very good hitter - he's not as bad as the Felipe Lopez/Christian Guzman contingent, but he's certainly not even in the vicinity of the Orlando Cabrerra/Alex Gonzlez "respectable but not spectacular" benchmark. He does nothing particularly well.
The worst part of it is, you do not need a lot of advanced metrics to figure this out. The fact that his defense is good but not spectacular should be readily obvious to the armchair scouts out there; Cubs fans voting in the Fan's Scouting Report pretty much came to that conclusion. Cubs fans are equally able to figure out his deficiencies on offense; the Community Projections over at Bleed Cubbie Blue were very much in line with what other projection systems were saying.
In fact, let's rerun his WAR, this time using nothing more than the collected wisdom of Cubs fans. Converting the Fans' Scouting Report to runs using Tango's method puts Theriot at plus 7 runs; for a projection we really should factor in aging and regression to the mean, but screw it. Fans project Theriot to have a .316 wOBA, a whole four points above CHONE. That works out to a WAR of 1.29 - certainly more optimistic than what I have here, but far from outstanding.
As a group, Cubs fans seem very able to figure out Ryan Theriot's absolute value as a player. So why do they seem so unable to grasp his relative value? Maybe it's just a case of the vocal minority skewing my perception of Cubs fans, I dunno.
As a bonus, some quick, largely non-Cubs related, thoughts:
- Troy Tulowitzki is an absolute monster. The second-best defensive shortstop in the game, and a solidly above-average hitter? There's a Coors Field effect in there, but damn.
- Plus 31 runs for Adam Everett? Holy crap. If you can think of a more underrated player in all of baseball, I'd love to hear your thoughts.
- Tejada shows up rather better than I thought he would. Without knowing the precise aging curve that Sean Smith used for his defensive projections, I'd have to be tempted to take the under on that projection, though.
- Erick Aybar is just bad. Just... bad. I really wonder what the Angels are planning to do about that.
- The Red Sox can't be happy about the Julio Lugo signing right now.
- What the hell, Cardinals? Cesar the Wonder Out is making $2.85 million on a one-year deal; Eckstein is making $4.5 million on a one-year deal. There's almost no way that the difference in performance between the two is worth $1.5 million - and it's possible that Eckstein would have given the Cardinals a hometown discount. Especially given Eckstein's marketing potential for the Cards (he's absolutely beloved by them), this is just stupid on their part.
Labels: Baseball, Chicago Cubs, Defense, Linear Weights, Projections, Ronny Cedeno, Ryan Theriot, WAR
Science is a differential equation. Fielding is a boundary condition.
1 Comments Published by Colin Wyers on Thursday, February 21, 2008 at 10:00 AM.
There are some things that computers are very good at doing:
- Putting men into space
- Track every aircraft in US airspace in real-time
- Simulate and model a nuclear explosion
- Play chess better than any human being
- Visualize basically anything
- Model the interactions of particles too small to measure
- Discover the nuclear processes in a dying star billions of miles away
- Decode the basis of all life on earth
Things computers cannot do, due to their innate complexity:
Oh-kay. Let's hear it from Cap'n Jetes himself:
"Maybe it was a computer glitch," the three-time Gold Glove winner said of the report. But Jeter just didn't laugh this one off. He defended himself, saying, "Every [shortstop] doesn't stay in the same spot, everyone doesn't have the same pitching. Everyone doesn't have the same hitters running, it's impossible to do that."
Jeter, 33, pointed out you can get the exact same ground ball off the exact same pitcher and there could be an average runner or there could be Ichiro running. "How can you compute that?" he asked.
That's an interesting question, Derek Jeter! Obviously there's no way that computers could know who the baserunners are on a batted ball! It's not as though a meticulous, play-by-play record of the events on a baseball field are kept.
Well, except for Retrosheet. And the BIS data and the STATS, Inc. data. And the MLB Gameday data you can download as XML files. So there's only several hundred ways we can compute all of the extra variables that Derek Jeter is talking about.
But still: Derek Jeter, more compicated than astrophysics or the human genome!
(Hat tip: Tango.)
Labels: Baseball, Defense, Derek Jeter
Another variation on my standard "Jason Marquis Sucks" rant
8 Comments Published by Colin Wyers on Monday, February 4, 2008 at 10:13 PM.
We are currently at a point where Jason Marquis is overrated - i.e., his percieved value exceeds his actual value. Jason Marquis has almost always been an overvalued pitcher, because baseball systematically overrates groundball pitchers - guys like Marquis in particular.
The reason why is pretty simple. Errors commited in 2007:
Outfielders: 484
Infielders (minus pitchers and catchers): 1838
That is an amazing difference. That is a phenominal difference. That is the sort of difference that blows my mind. And an error is a Get Out Of Jail Free card for crappy pitchers, because it lets them give up runs with abandon for the rest of the inning without having to take any responsibility for it.
How does this relate to Jason Marquis? Simple. 2007, NL and AL (I should have split them up, but this should serve to illustrate):
Average ERA: 4.47
Average RA: 4.83
Average URA: 0.36
ERA I’m sure you all understand. RA uses both earned and unearned runs, URA is Unearned Run Average, basically RA minus ERA.
Now, Jason Marquis, 2007:
ERA: 4.60
RA: 5.21
URA: .61
Jason Marquis gave up unearned runs at twice the league average. And Cubs fielders gave up the fewest “unearned” runs of any team in the National League.
This is not a fluke, an accident or an artifact of sample size - this is because Jason Marquis is a ground ball pitcher without notable skill.
This entirely ignores the fact that Marquis had a pitiful strikeout rate and caught a bad case of gopheritis during the summer. Oh, and the fact that Marquis did not cut down on his walk rate after it spiked up in his disasterous 2006 season. He’s a walking time bomb and if the Cubs can trade him while he still has value, then do it. Pitch Jo-Jo the Dog Faced Boy in his rotation spot if you have to, just get him on the first flight out of Chicago.
Labels: Baseball, Chicago Cubs, Defense, Jason Marquis
Minor league defensive statistics
0 Comments Published by Colin Wyers on Friday, February 1, 2008 at 4:48 PM.
Labels: Baseball, Defense, Minor Leagues
Throwdown to Showdown! Theriot vs. DeRosa
10 Comments Published by Colin Wyers on Tuesday, January 29, 2008 at 1:40 PM.
Two people (which is a not-insubstantial proportion of my readership at this point) are curious about Ryan Theriot's defense, and how he stacks up compared to the league average. One specifically wants to know how he stacks up against the Cubs 2007 MVP-in-Spirit, Mark DeRosa. (Derrek Lee being the MVP-in-Fact.)
Well, I'm happy to oblige. Welcome to Thunderdome. Two scrappy, white middle infielders enter; one scrappy, white middle infielder leaves.
Mark DeRosa was +2.5 Batting Runs compared to the league average in 2007; Ryan Theriot was -22.8 Batting Runs. (It turns out that SS, 2B and CF hit for roughly the league average. This doesn't matter so much just comparing the two, but it's useful to note.)
But what about next season? I would expect DeRosa's offense to fall of a bit, and Theriot's to improve by a bit. CHONE sees DeRosa as being right around league average, and Theriot to be -12 compared to average. ZiPS sees DeRosa about 2-3 runs below average, Theriot roughly -15. So 12 runs different on offense, or about a win.
The short answer on defense: Sean Smith makes his defensive projections available; they're not the best projections on defense but they're the best readily available. (MGL's UZR defensive projections are probably the best I'm aware of, but UZR is published sporadically at best.) The projection sees Theriot defensively at -1 at shortstop, and DeRosa at -6.
So between the two, I'd say that DeRosa is the better choice at shortstop between the two. Both of them would be below-average shortstops, but I think we had all figured that out already.
This is just a quick, cursory look at the question; I plan on doing some posts in a while that go more in-depth into offensive and defensive metrics in general, and may touch on the specific merits (or lack thereof) of Ryan Theriot more when I do.
For those curious - CHONE has Cedeno at -6 on offense, and ZiPS has him about even with Theriot. The defensive projections see Cedeno as even with Theriot.
Edit: If you believe ZiPS, then your best infield (with current personnel) is probably: Lee, Fontenot, DeRosa, Ramirez. (Fontenot is -11 at shortstop, if you're curious.) If you believe CHONE, then it's Lee, DeRosa, Cedeno, Ramirez.
Labels: Baseball, Chicago Cubs, Defense, Linear Weights, Mark DeRosa, Ryan Theriot, Steel-Cage Match
