Looking for defensive shifts
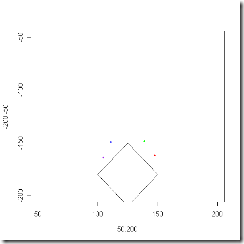
0 Comments Published by Colin Wyers on Tuesday, April 29, 2008 at 11:14 PM.Continuing with making defensive graphs, I thought it might be illuminating to try and see exactly how much defensive positioning impacts where ground balls are fielded. The following are graphs of the average location of a fielded ground ball, color-coded by position.
First off, every ball in the data set:
Makes sense, I suppose. We'll call that our reference graph.
Now, let's take a look at just right handed batters with the bases empty:
Virtually identical - everybody plays "straight-up" in that situation. But now let's look at the same situation with a left-handed batter:
It's a subtle shift, but a shift nonetheless. The middle infielders seem to "cheat" a bit to their left, and the third baseman seems to be doing a heck of a lot of cheating, not only over but shallow.
Now, with a runner on first (second and third empty):
Everybody but the first baseman seems to play straight up - the first baseman plays a lot shallower, though. With runners on first and second:
That looks pretty much like our reference graph - maybe the third baseman's playing a little in, but other than that everyone is playing straight up. With the bases loaded:
Looks like everyone is playing straight up. Now, let's take a look at how fielders position themselves when a handful of lefty sluggers (Thome, Ortiz, Fielder, Giambi and Hafner) are at bat:
That's the wishbone shift, and I'm really pleased that the graph is capturing it so well.
The next step is to look at the number of outs in the inning and see how that affects defensive positioning. (Unless something else shiny distracts me first.)
Labels: Baseball, Defense, Enhanced Gameday


0 Responses to “Looking for defensive shifts”
Post a Comment