Can we measure a fielder's range?
0 Comments Published by Colin Wyers on Thursday, April 24, 2008 at 11:45 PM.First of all, let's define range as a fielder's ability to get to baseballs. For the purposes of this analysis, we don't care what a fielder does with the ball when he gets to it. We're only interested in how far he can go to get to a baseball.
Pretty much any defensive metric you see that attempts to measure range is really an approximation based upon the data available. The more data we have, the better (play-by-play data is better than seasonal totals; zone rating is even better) but the best thing would be to know:
- Where the ball was fielded, and
- Where the fielder was standing where the ball was hit.
I am unaware of anyone who keeps track of #2, but there are several outlets that keep track of #1. MLB.com keeps track of it for their Enhanced Gameday functionality. MLB Advanced Media, at least currently, makes that data available to researchers. Most commonly it's used in PitchF/X analysis, but for right now I'm just using the hit location data.
Rather than parse the remainder of the data I needed from the verbatim description (which is something I'd love to start doing, but let's just say that regular expressions scare me) I merged the hit location data with the Retrosheet play-by-play data. (The boilerplate: The information used here was obtained free of charge from and is copyrighted by Retrosheet. Interested parties may contact Retrosheet at 20 Sunset Rd., Newark, DE 19711.) Dan Turkenkopf has a great parser that links the Gameday XML files up with the appropriate Retrosheet IDs. A few SQL queries later, and bingo, data! I filtered for all ground balls and divided them up by what position was responsible for fielding them. The result of the play (hit, error or out) was also recorded, although not used in the presentation here.
But what to do with the data? I decided to try plotting it with GNU R, a free statistics and graphing programming tool. The basics of this are covered in Baseball Hacks, by Joseph Adler. Additional functionality is provided by the Geneplotter library.
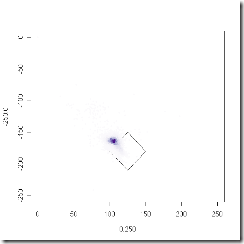
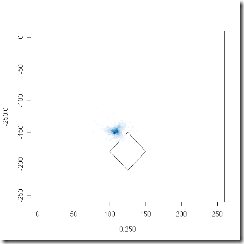
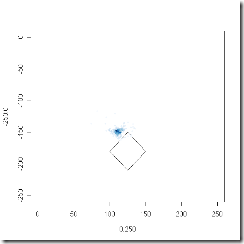
Okay, here we go - plots!
First base:
Second base:
Shortstop:
Third base:
Those are our reference images - all fielders from 2007 are included. Now, let's take a look at a handful of shortstops, just to see how a few different players look.
Troy Tulowitzki:
Adam Everett:
Derek Jeter:
Ryan Theriot:
I'll be the first to admit - if it wasn't nearly 2 in the morning, I would spend a little more time on cleaning up these graphs. The pitches right on the edges seem a bit more difficult to "read," for one. And I don't really need the entire field like that for just infielders - we can do the same thing with outfielders, I just haven't yet.
I'm just "doodling" with the data for now - if there is quantitative analysis to be done with this data, it'll have to wait at least until morning. I would love to put that Tulo graph next to that Jeter graph and show it to a bunch of Yankees fans, see what they have to say about it. Suggestions and requests are welcome.
Labels: Baseball, Defense, Enhanced Gameday


0 Responses to “Can we measure a fielder's range?”
Post a Comment